Manufacturing ISM Report On Business®, March 2014
National report (USA), released by ISM on April 1, 2014.
The report was issued on April 1 by Bradley J. Holcomb, CPSM, CPSD, chair of the Institute for Supply Management™ Manufacturing Business Survey Committee.
 “The March PMI® registered 53.7 percent, an increase of 0.5 percentage point from February’s reading of 53.2 percent, indicating expansion in manufacturing for the 10th consecutive month. The New Orders Index registered 55.1 percent, an increase of 0.6 percentage point from February’s reading of 54.5 percent. The Production Index registered 55.9 percent, a substantial increase of 7.7 percentage points compared to February’s reading of 48.2 percent. Employment grew for the ninth consecutive month, but at a lower rate by 1.2 percentage points, registering 51.1 percent compared to February’s reading of 52.3 percent. Several comments from the panel reflect favorable demand and good business conditions, with some lingering concerns about the particularly adverse weather conditions across the country.”
PERFORMANCE BY INDUSTRY
Of the 18 manufacturing industries, 14 are reporting growth in March in the following order: Petroleum & Coal Products; Transportation Equipment; Furniture & Related Products; Paper Products; Printing & Related Support Activities; Plastics & Rubber Products; Fabricated Metal Products; Machinery; Textile Mills; Computer & Electronic Products; Nonmetallic Mineral Products; Food, Beverage & Tobacco Products; Chemical Products; and Primary Metals.
The four industries reporting contraction in March are: Apparel, Leather & Allied Products; Wood Products; Electrical Equipment, Appliances & Components; and Miscellaneous Manufacturing.
WHAT RESPONDENTS ARE SAYING …
- “Seeing improvement in the overall economy. Hearing strong bookings in residential contractor and home repair work.” (Paper Products)
- “First quarter business still strong.” (Fabricated Metal Products)
- “Business beginning to heat-up, along with the weather.” (Petroleum & Coal Products)
- “Business is good and we are optimistic that orders will continue to come in at a decent pace.” (Transportation Equipment)
- “Year starting off very good. Outlook very bright for 2014.” (Computer & Electronic Products)
- “Export orders are picking up — volume is improving although pricing, and thus profitability, are still challenged. Domestic business seems to be holding steady despite earlier predicted declines.” (Chemical Products)
- “Short supply of hardwood lumber continues to challenge sales’ ability to maximize volume targets. Demand is sound.” (Wood Products)
- “Weather has created major delays on inbound materials and outbound sales. We need spring.” (Food, Beverage & Tobacco Products)
- “Economy is looking positive and commodities are stable.” (Machinery)
- “Business continues to improve.” (Furniture & Related Products)
PMI (Purchasing Managers Index) March 2014
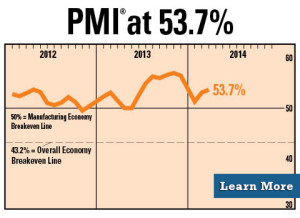
Manufacturing expanded in March as the PMI® registered 53.7 percent, an increase of 0.5 percentage points when compared to February’s reading of 53.2 percent. A reading above 50 percent indicates that the manufacturing economy is generally expanding; below 50 percent indicates that it is generally contracting.
A PMI® in excess of 43.2 percent, over a period of time, generally indicates an expansion of the overall economy. Therefore, the March PMI® indicates growth for the 58th consecutive month in the overall economy, and indicates expansion in the manufacturing sector for the 10th consecutive month. Holcomb stated, “The past relationship between the PMI® and the overall economy indicates that the average PMI® for January through March (52.7 percent) corresponds to a 3.1 percent increase in real gross domestic product (GDP) on an annualized basis. In addition, if the PMI® for March (53.7 percent) is annualized, it corresponds to a 3.5 percent increase in real GDP annually.”
Read the full Manufacturing ISM Report On Business…
The data presented in the Manufacturing ISM Report On Business®, is obtained from a survey of manufacturing supply managers based on information they have collected within their respective organizations. ISM makes no representation, other than that stated within this release, regarding the individual company data collection procedures. Use of the data is in the public domain and should be compared to all other economic data sources when used in decision-making. View the Manufacturing ISM Report On Business® »
About the Manufacturing ISM Report On Business
The Manufacturing ISM Report On Business® is published monthly by the Institute for Supply Management™. The Institute for Supply Management™, established in 1915, is the largest supply management organization in the world as well as one of the most respected. ISM’s mission is to lead the supply management profession through its standards of excellence, research, promotional activities and education. This report has been issued by the association since 1931, except for a four-year interruption during World War II.
The Manufacturing ISM Report On Business® is based on data compiled from purchasing and supply executives nationwide. Membership of the Manufacturing Business Survey Committee is diversified by NAICS, based on each industry’s contribution to gross domestic product (GDP). Manufacturing Business Survey Committee responses are divided into the following NAICS code categories: Food, Beverage & Tobacco Products; Textile Mills; Apparel, Leather & Allied Products; Wood Products; Paper Products; Printing & Related Support Activities; Petroleum & Coal Products; Chemical Products; Plastics & Rubber Products; Nonmetallic Mineral Products; Primary Metals; Fabricated Metal Products; Machinery; Computer & Electronic Products; Electrical Equipment, Appliances & Components; Transportation Equipment; Furniture & Related Products; and Miscellaneous Manufacturing (products such as medical equipment and supplies, jewelry, sporting goods, toys and office supplies).
Survey responses reflect the change, if any, in the current month compared to the previous month. For each of the indicators measured (New Orders, Backlog of Orders, New Export Orders, Imports, Production, Supplier Deliveries, Inventories, Customers’ Inventories, Employment and Prices), this report shows the percentage reporting each response, the net difference between the number of responses in the positive economic direction (higher, better and slower for Supplier Deliveries) and the negative economic direction (lower, worse and faster for Supplier Deliveries), and the diffusion index. Responses are raw data and are never changed. The diffusion index includes the percent of positive responses plus one-half of those responding the same (considered positive).
The resulting single index number for those meeting the criteria for seasonal adjustments (PMI, New Orders, Production, Employment, Supplier Deliveries and Inventories) is then seasonally adjusted to allow for the effects of repetitive intra-year variations resulting primarily from normal differences in weather conditions, various institutional arrangements, and differences attributable to non-moveable holidays. All seasonal adjustment factors are supplied by the U.S. Department of Commerce and are subject annually to relatively minor changes when conditions warrant them. The PMI is a composite index based on the seasonally adjusted diffusion indexes for five of the indicators with equal weights: New Orders, Production, Employment, Supplier Deliveries and Inventories.
Diffusion indexes have the properties of leading indicators and are convenient summary measures showing the prevailing direction of change and the scope of change. A PMI reading above 50 percent indicates that the manufacturing economy is generally expanding; below 50 percent indicates that it is generally declining. A PMI in excess of 42.5 percent, over a period of time, indicates that the overall economy, or gross domestic product (GDP), is generally expanding; below 42.5 percent, it is generally declining. The distance from 50 percent or 42.5 percent is indicative of the strength of the expansion or decline. With some of the indicators within this report, ISM has indicated the departure point between expansion and decline of comparable government series, as determined by regression analysis.
Responses to Buying Policy reflect the percent reporting the current month’s lead time, the approximate weighted number of days ahead for which commitments are made for Production Materials; Capital Expenditures; and Maintenance, Repair and Operating (MRO) Supplies, expressed as hand-to-mouth (five days), 30 days, 60 days, 90 days, six months (180 days), a year or more (360 days), and the weighted average number of days. These responses are raw data, never revised, and not seasonally adjusted since there is no significant seasonal pattern.